
Geopolitics of Food
Trade Flows, Fertiliser, World Hunger and Export Controls
12 July 2026
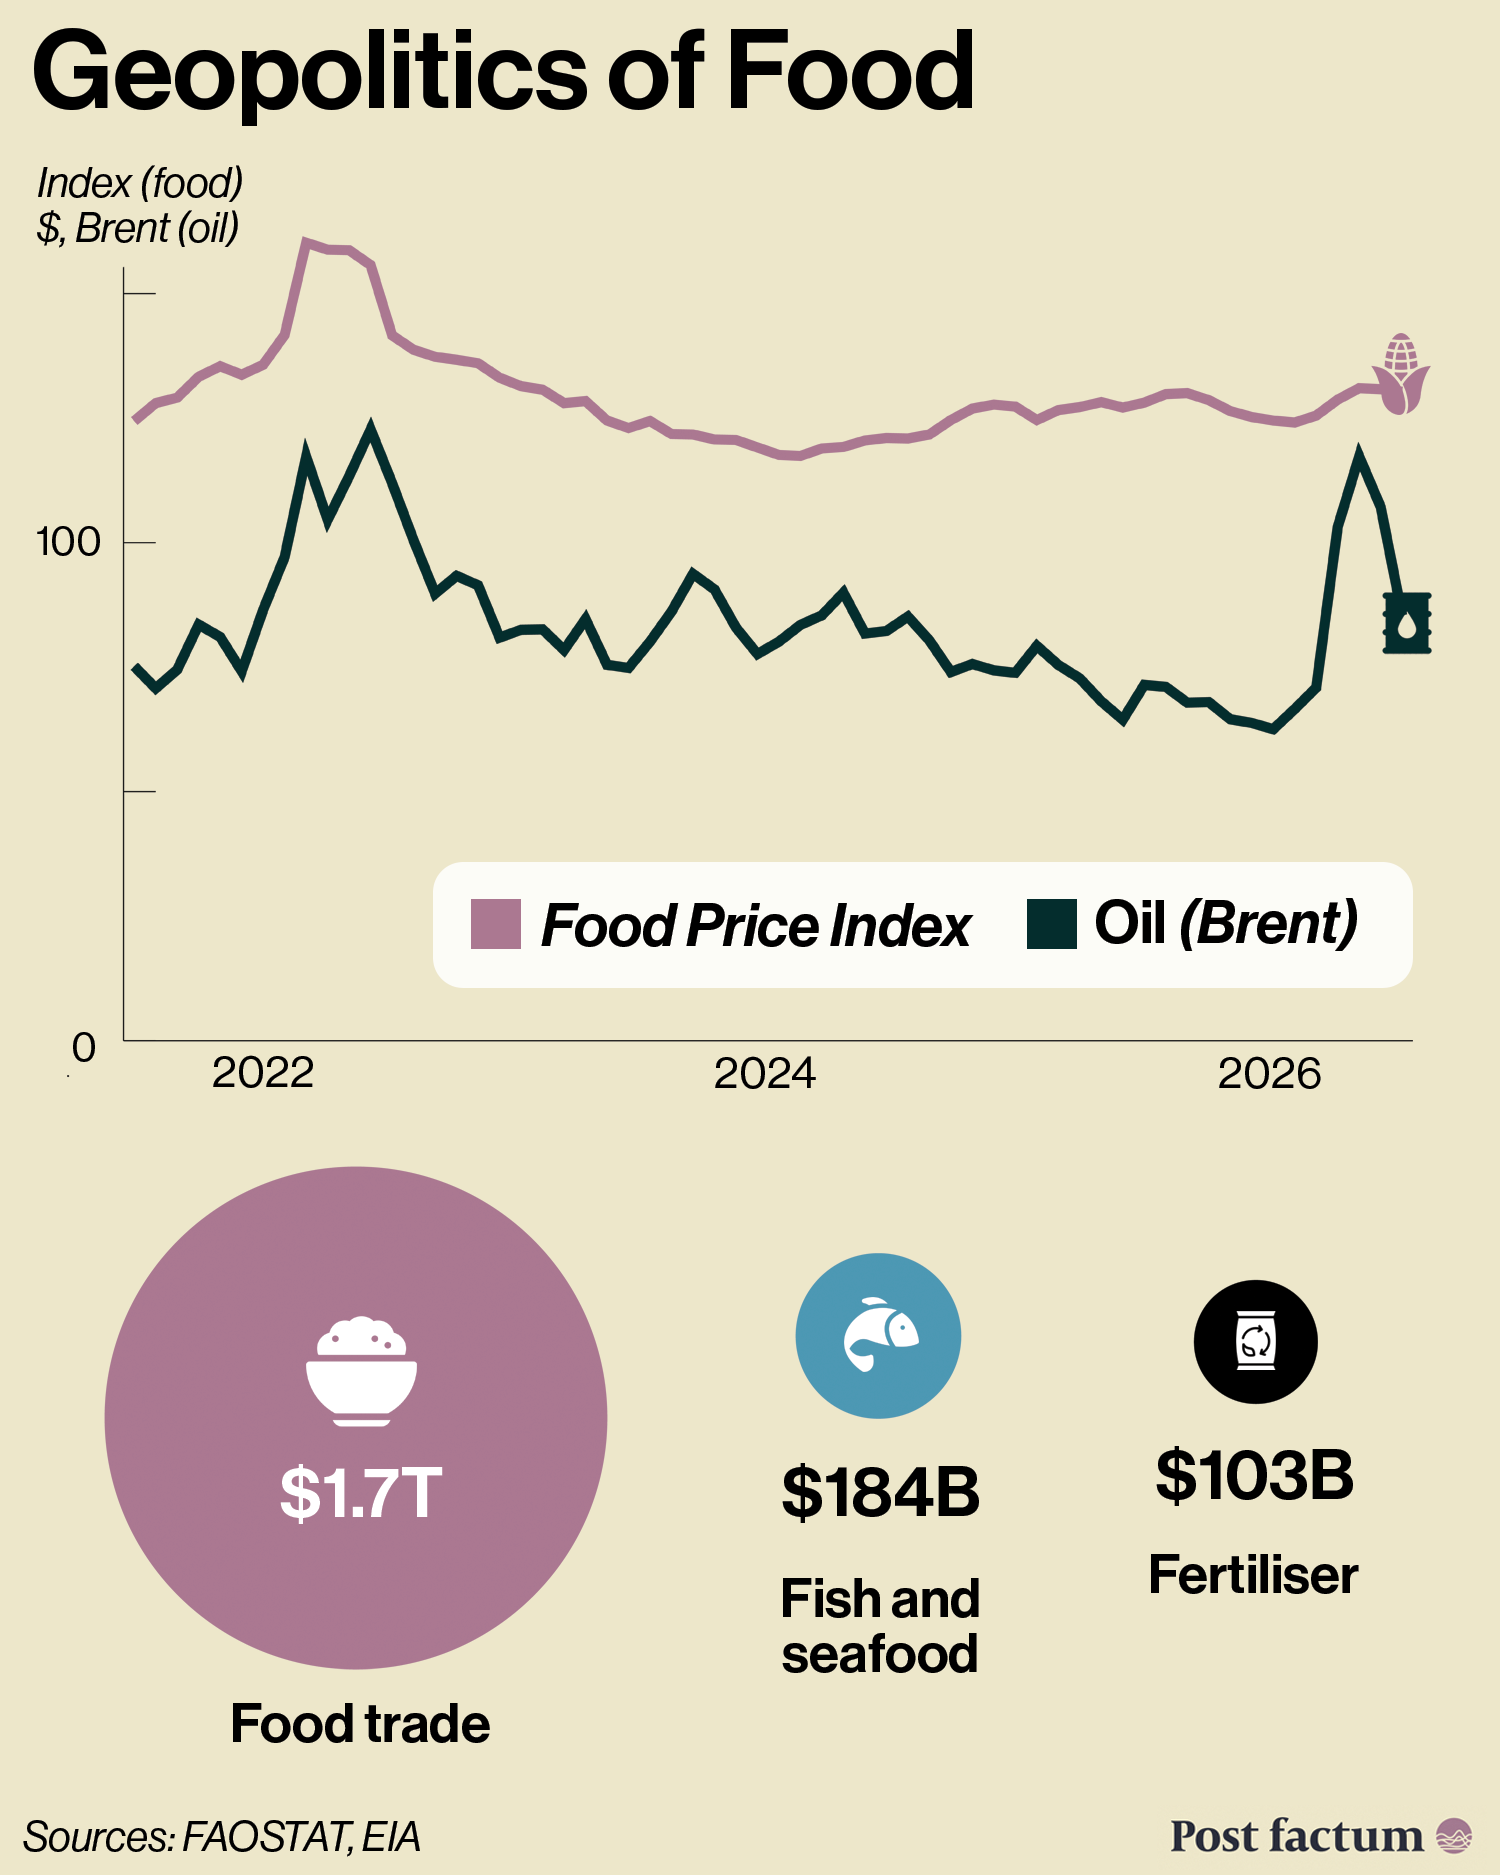
Countries trade around $2 trillion of food per year, 8% of all goods trade and more than the trade in crude oil.
The wider food market is around $10 trillion a year, as most food never crosses a border.
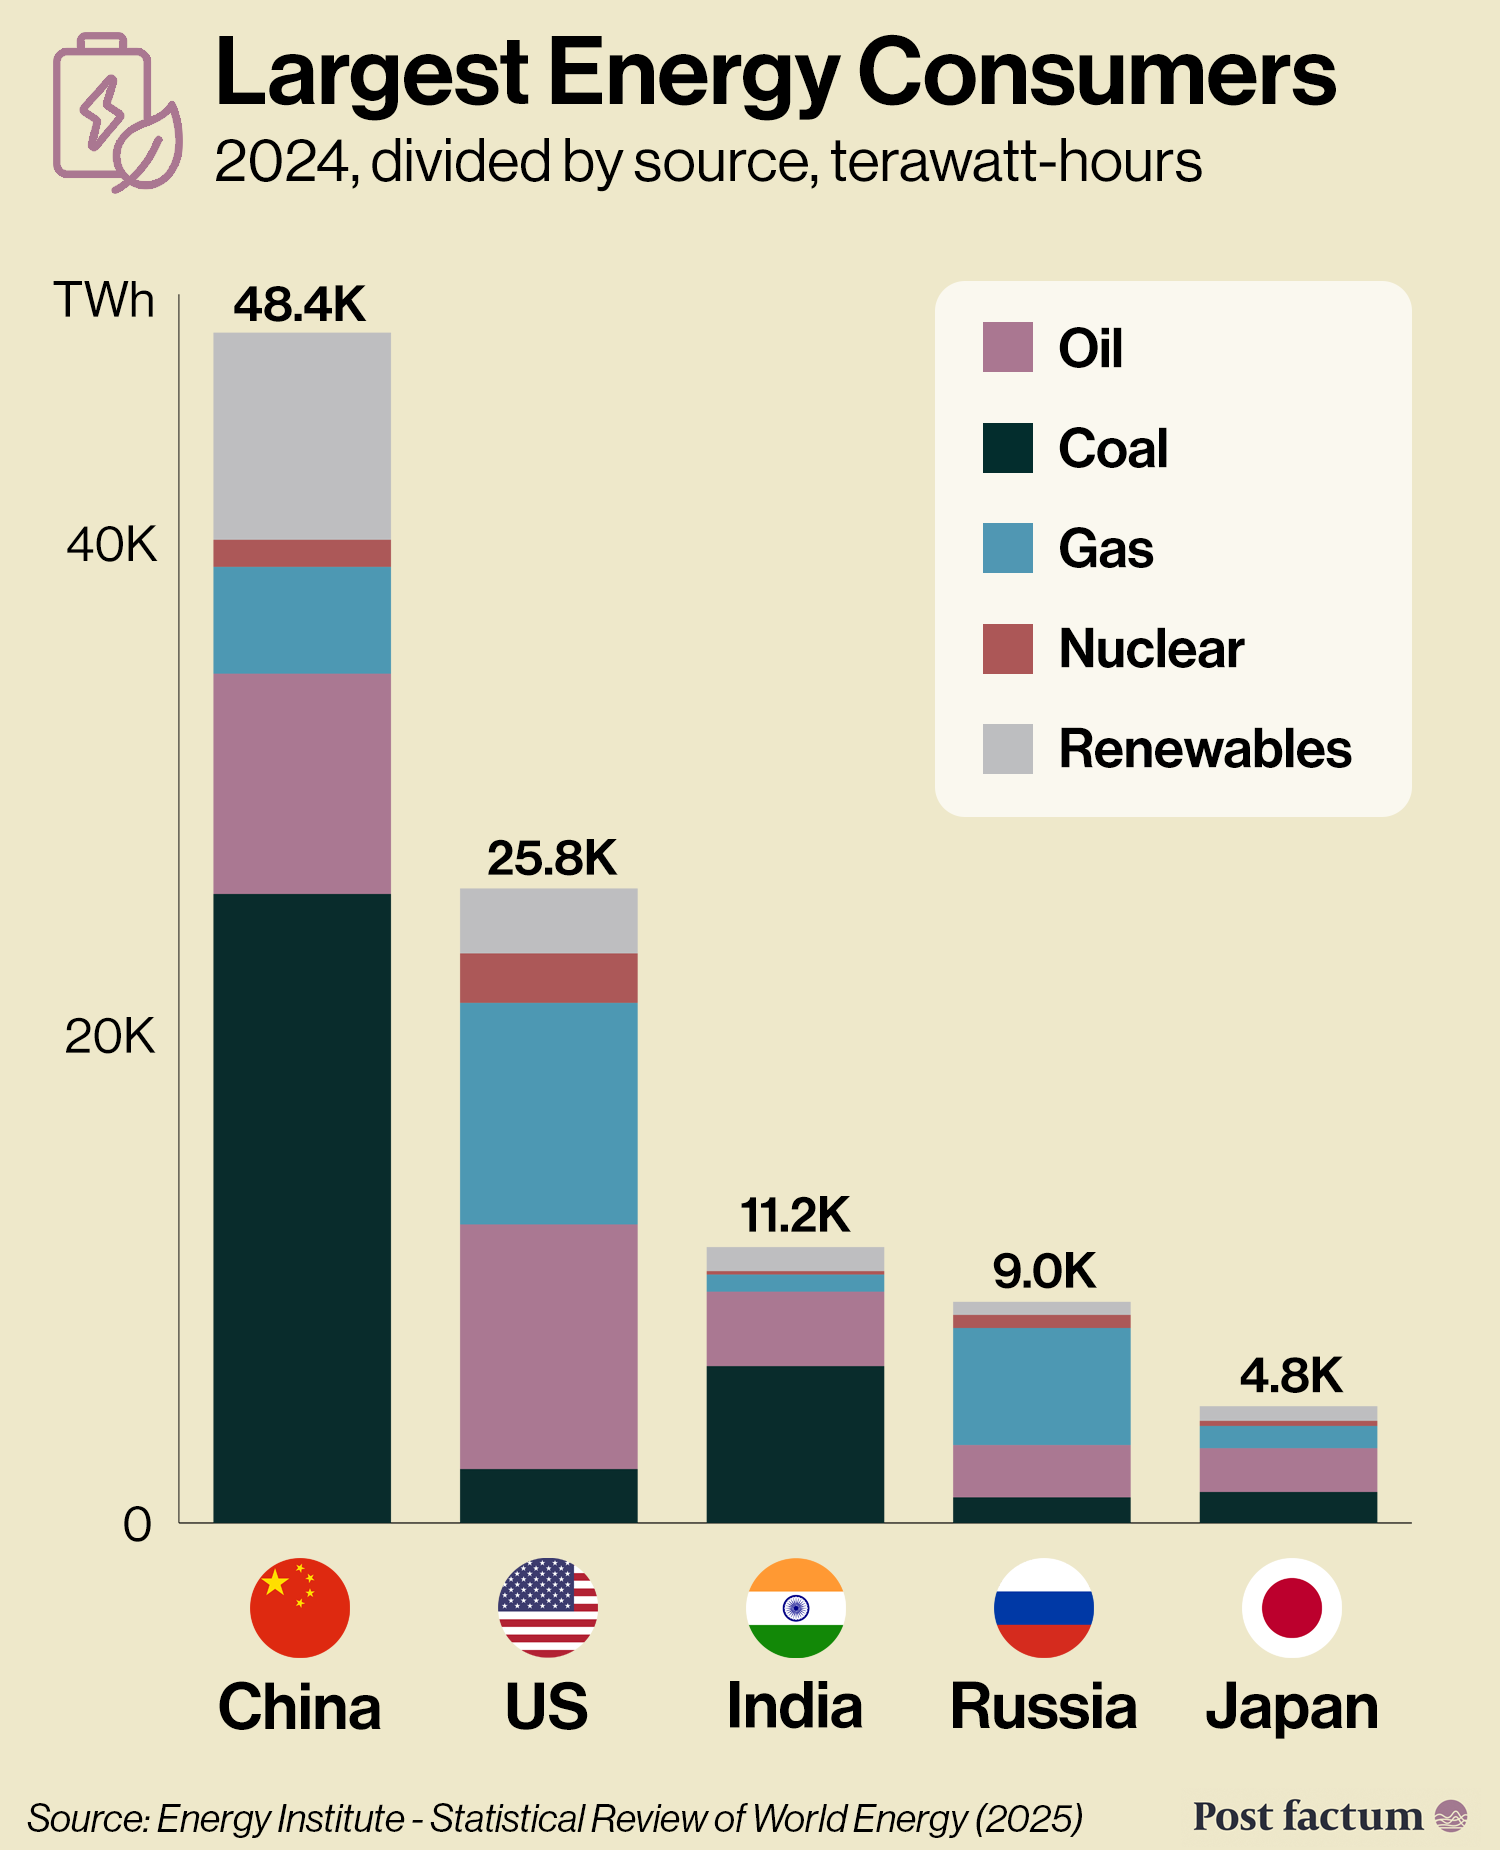
Most fertiliser is made from natural gas, while farming and transport run on diesel, so energy costs are linked with the price of food.
- When European gas prices rose about tenfold in 2022, fertiliser factories cut output and world food prices hit a record high.
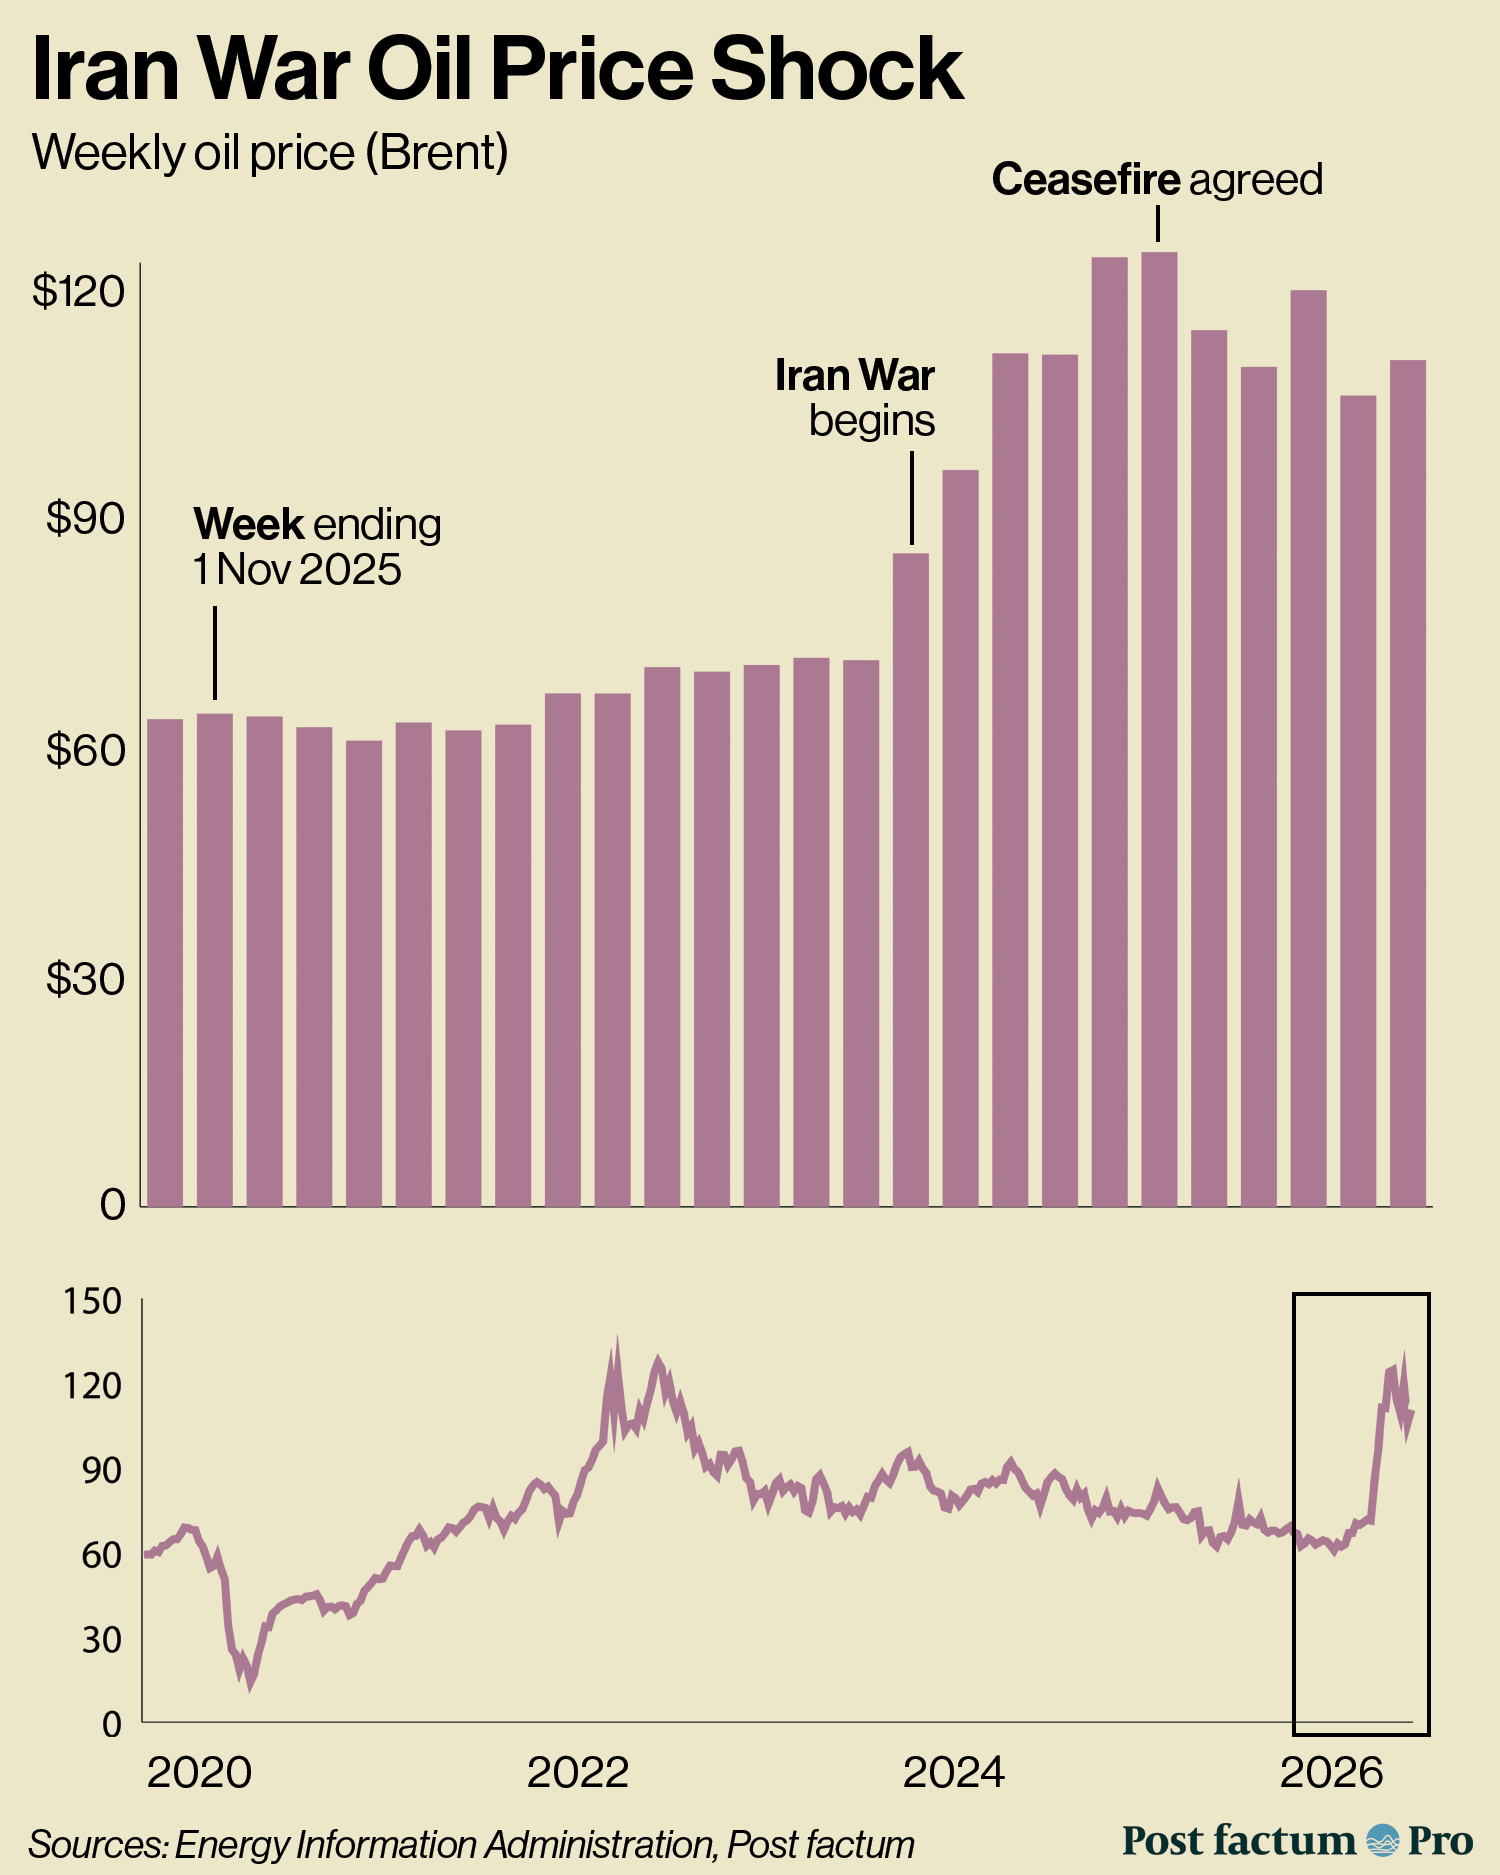
The closure of the Strait of Hormuz has pushed up the prices of fertilisers again.
Food determines the cost of living: it takes under 10% of household spending in rich countries but over 50% in poorer states.
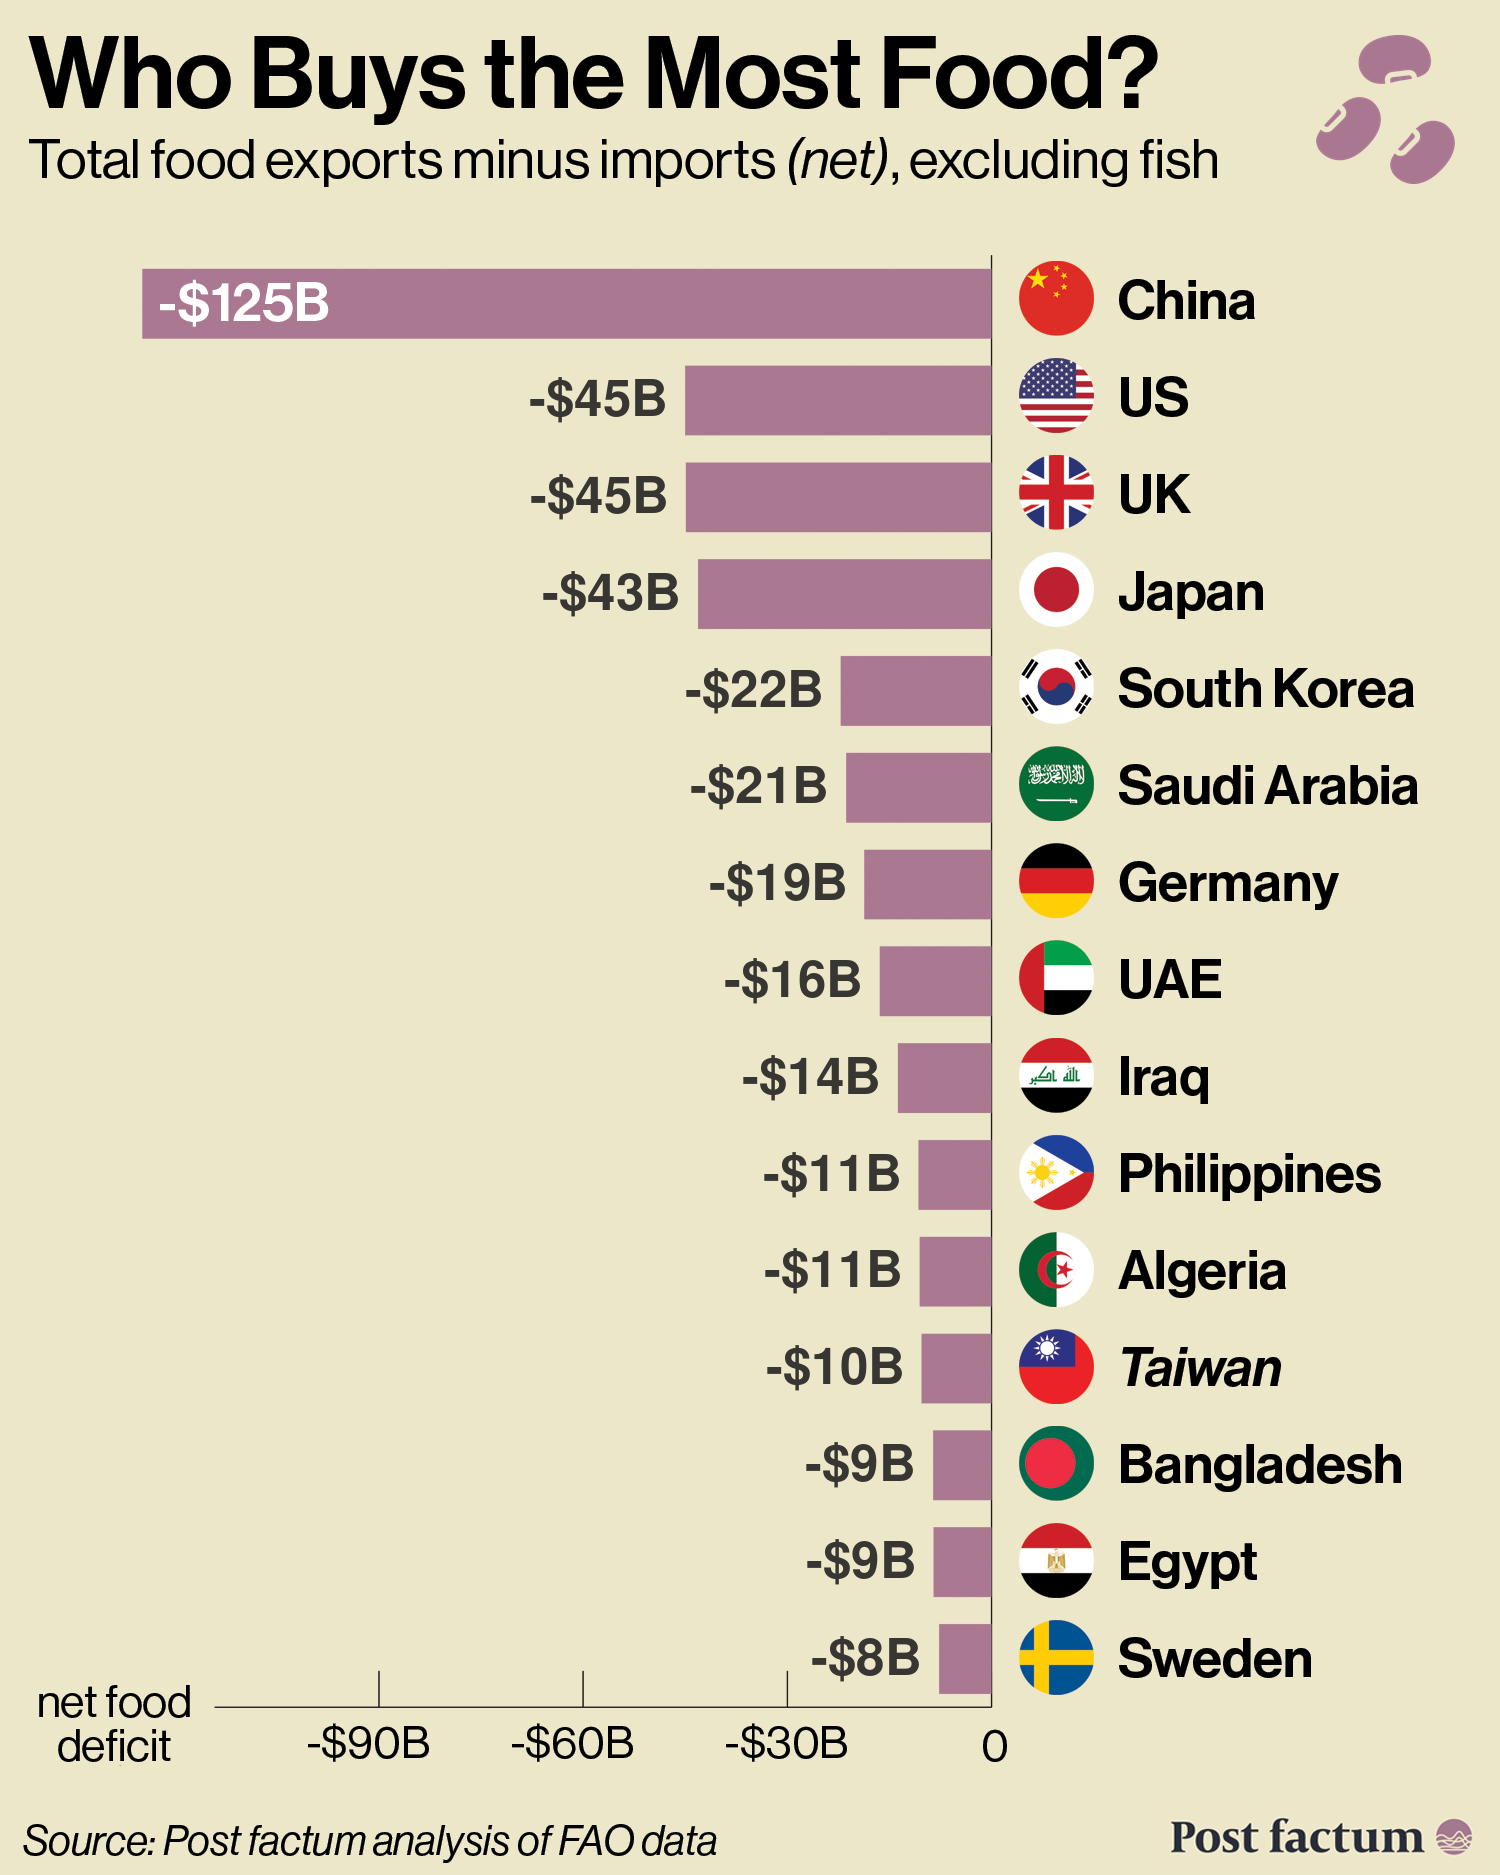
China is the largest net food importer: it bought $125 billion more food than it sold in 2024, followed by the US, the UK and Japan.
- Middle Eastern and North European states are the largest net importers per person.
China holds 50% of the world’s stockpiled corn and wheat.
Export bans from major producers have an impact on prices globally.
Fertiliser
Fertiliser supports about half of global food production and must be applied every season.
It comes in 3 types: nitrogen (N), made from natural gas, and mined phosphate (P) and potash (K).
Russia is the largest exporter in this $103 billion market, and Morocco holds 70% of the world’s phosphate rock.
Canada, Russia and Belarus supply about 70% of traded potash.
- Sanctions on Russia do not cover fertiliser, and Russian sales to Brazil, which imports 85% of its supply, grew after 2022. Sanctions on Belarusian fertiliser were eased, partly for diplomatic leverage against Canada.
Other chemicals are needed for farming too. For example, insect-killing pesticides, for which China produces around 70% of the components.
The production of seeds is another separate industry that affects the food market.
World Hunger
About 673 million people, 8% of humanity, were undernourished in 2024, and 2.3 billion had no reliable access to enough food.
Conflict was the main cause for 56% of the 266 million people in crisis-level hunger in 2025.
Extreme hunger (famine) was confirmed in both Sudan and Gaza in 2025, after blockades and sieges cut off food supplies.
The main traded foods, by yearly trade value:
- Wheat ($55B): Russia leads exports (24%), and the Middle East and North Africa depend on imports. Ukraine, normally a major player, now exports less grain due to the war.
- Rice ($33B): India sells 40% of exports, and its policies affect rice prices globally, as only 10% of the world’s rice output is traded.
- Corn ($45B): the US, Brazil and Argentina sell 70% of exports; Mexico and East Asia buy the most.
- Soybeans ($75B): Brazil sells 57% of exports and China buys 61% of imports, mostly for animal feed. China previously imported more from the US, which is a source of disputes.
- Soybean meal ($28B): Argentina sells most of the processed soybean meal while the EU is the largest buyer. China mostly crushes its imported soybeans into meal locally.
- Palm oil ($45B): Indonesia and Malaysia sell about 85% of exports; India and China buy the most.
- Beef ($65B): Brazil is the top exporter (29%) and China the top importer (30%).
- Dairy ($55B): New Zealand leads exports (27%), mostly milk powder; China is the largest buyer.
- Poultry ($30B): Brazil and the US sell over half of exports to widely spread buyers.
Fish and Seafood
Fish and seafood is the largest traded category, worth $186 billion in 2024, with over a third of output traded.
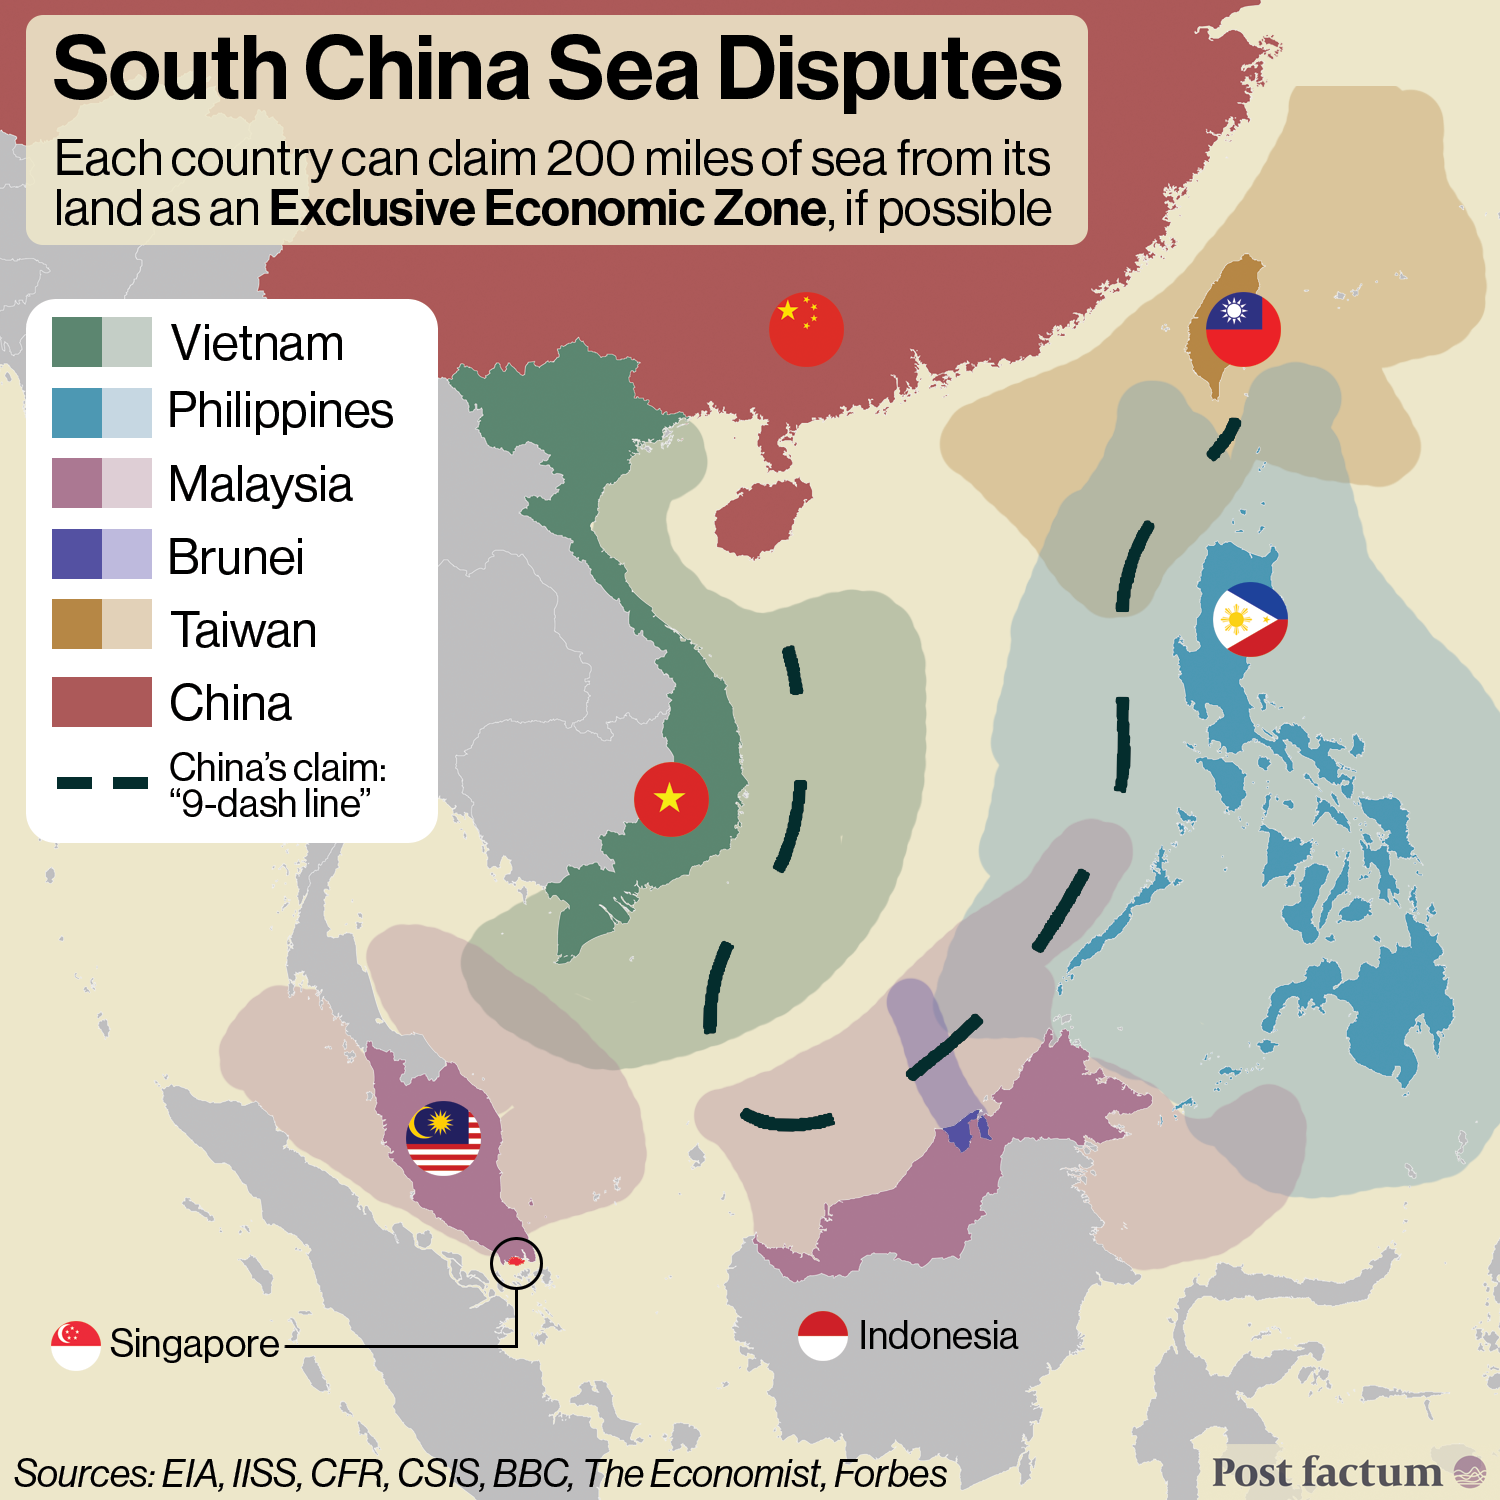
States have fishing rights up to 370 km from their coasts (exclusive economic zones), and the South China Sea disputes are partly over fishing rights.
China, Norway, Vietnam and Ecuador export the most; the US, the EU and Japan import the most.
- Fish farming now slightly exceeds the share of open-water fishing, which has held steady in total volume since the 1990s.
China operates the world’s largest distant-water fishing fleet, up to 16,000 vessels mostly off the coasts of South America and Africa.
- It accounts for over 50% of the global deep-sea squid catch, as well as a large share of Pacific tuna.
China’s distant-water fleet commits the most acts of illegal fishing globally and is linked with the use of forced labour, such as debt bondage of the workers at sea.
Curious Case of the Netherlands
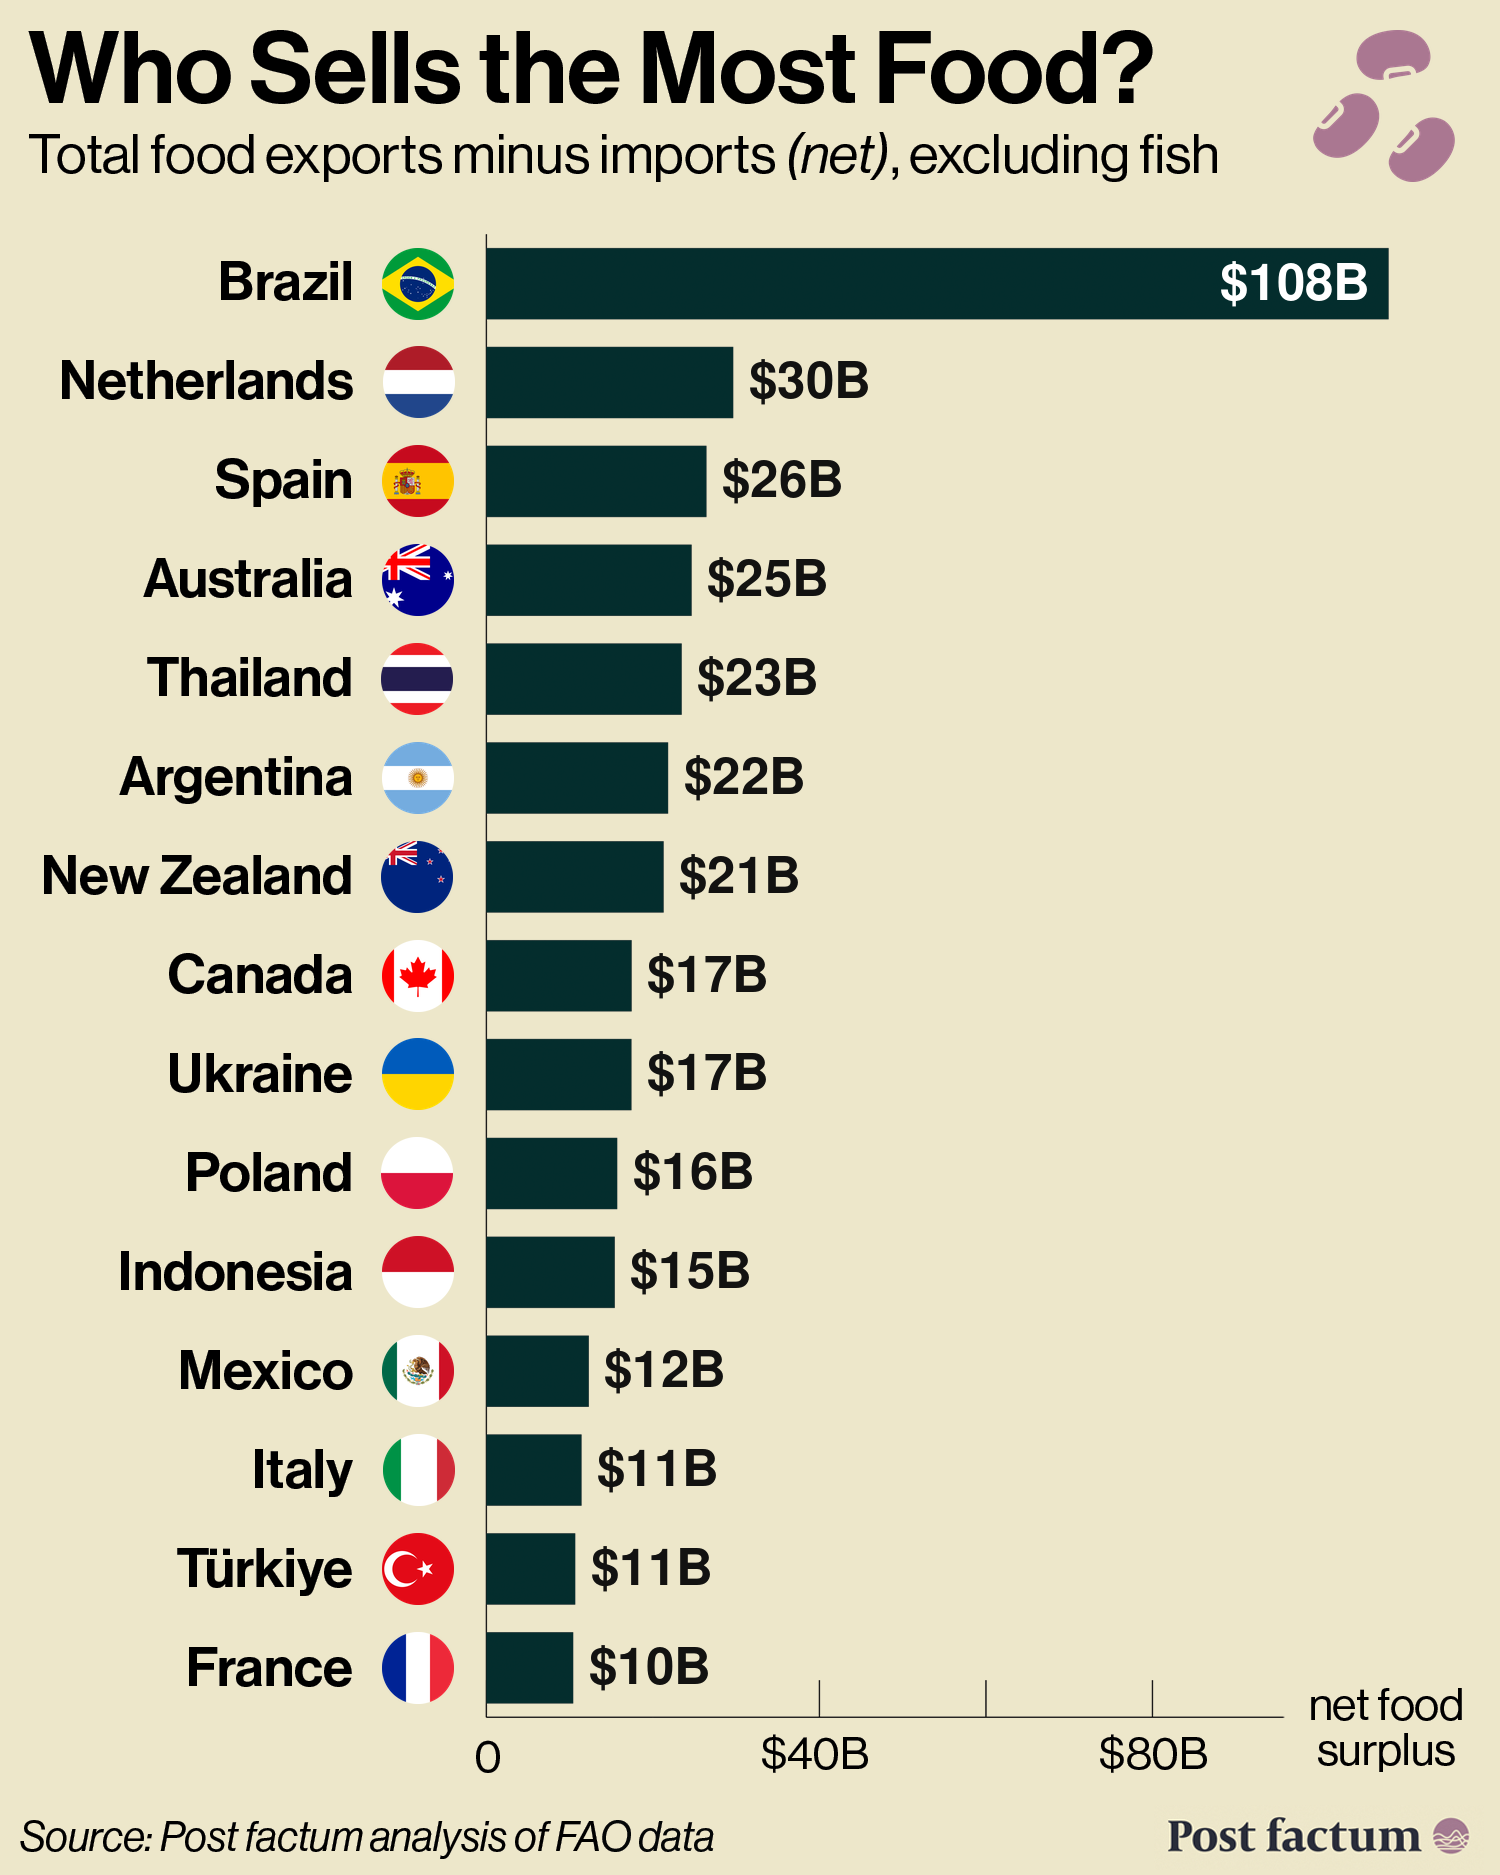
The Netherlands was the world’s 2nd largest net food exporter in 2024, selling $30 billion more than it bought, behind only Brazil.
A resale hub: much of the flow is imported food sold on to the rest of Europe.
The rest is intensive production: high-tech greenhouses and dense livestock farming on imported feed, despite very limited land.
However, if counted in calories and protein, the Netherlands is a food importer.
This is largely because it relies on foreign farms to produce the animal feeds used.
Thank you for reading!
Keep exploring:
This week on Post factum Pro:

Join Post factum Pro to access the comment section.