
Demographic Trends, explained
Population Peak, Fertility and Migration
Remastered: 4 October 2026
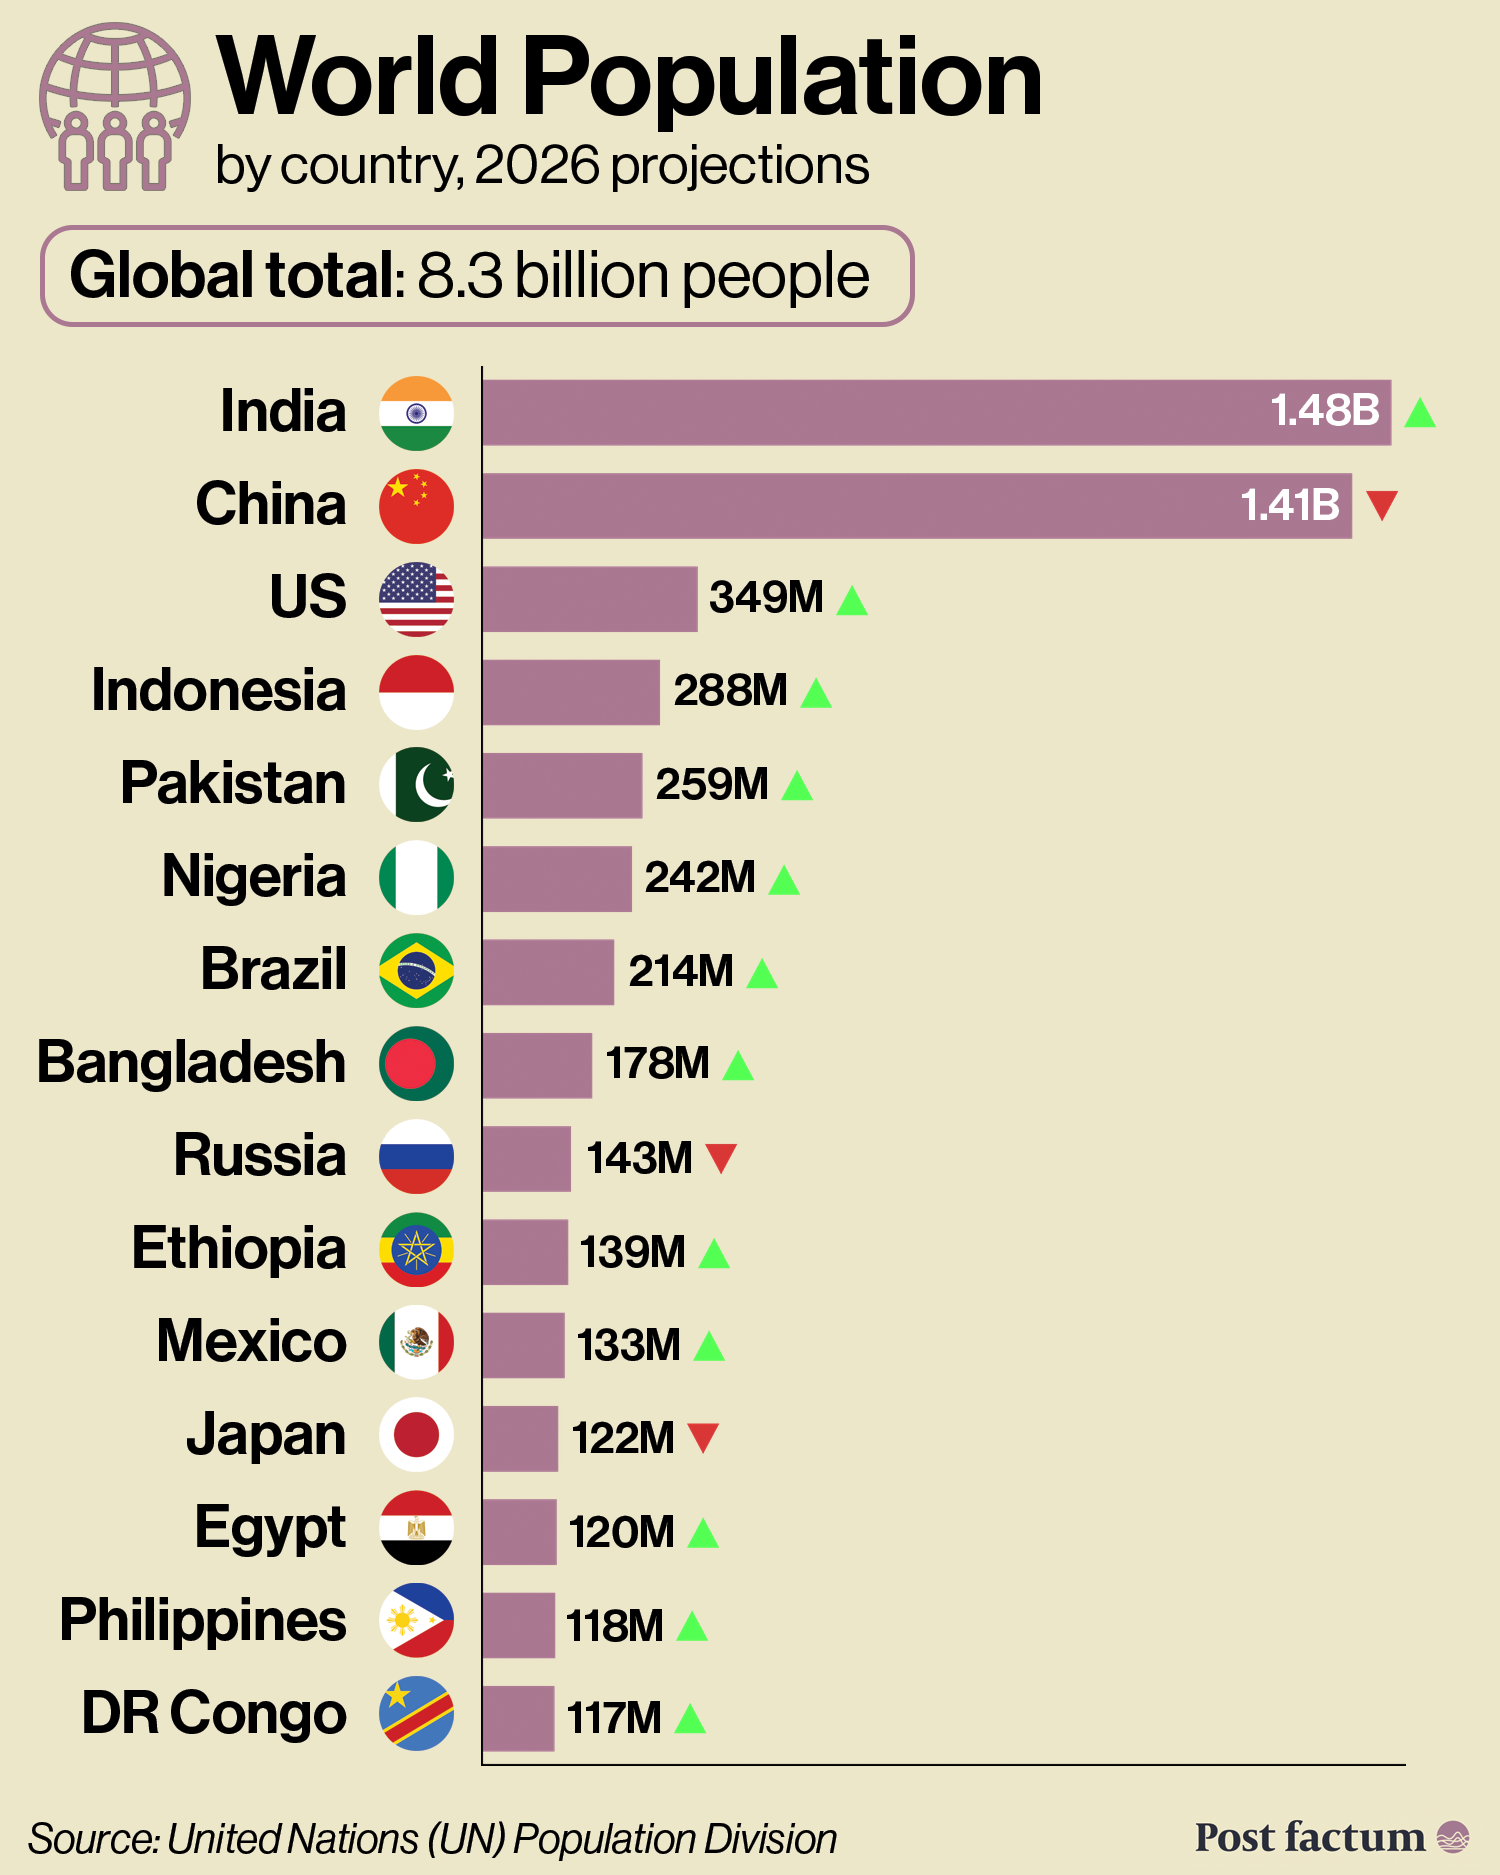
The Peaking Population
The world population grew by 70 million people in 2025, or less than 1%.
UN projected the population to peak at 10.3 billion in 2084, before starting to decline.
Why? Declining fertility rate (average number of births per woman over a lifetime).
Reasons for fertility decline:
- Urbanisation: raising children costs more in cities, and social norms change as people shift from agricultural work.
- Female empowerment: more women study and work, having fewer children, later.
- Healthcare: lower child mortality reduced the need for many children.
- Contraception: family planning lets people have the number of children they want.
A fertility rate of 2.1 keeps the population size stable over time (replacement rate), assuming few children die young and there is no migration.
- Japan, South Korea and China kept growing for 30+ years after falling below 2.1, as many people were of child-bearing age.
The global fertility rate peaked at 5.3 in 1963 and was about 2.25 in 2024.
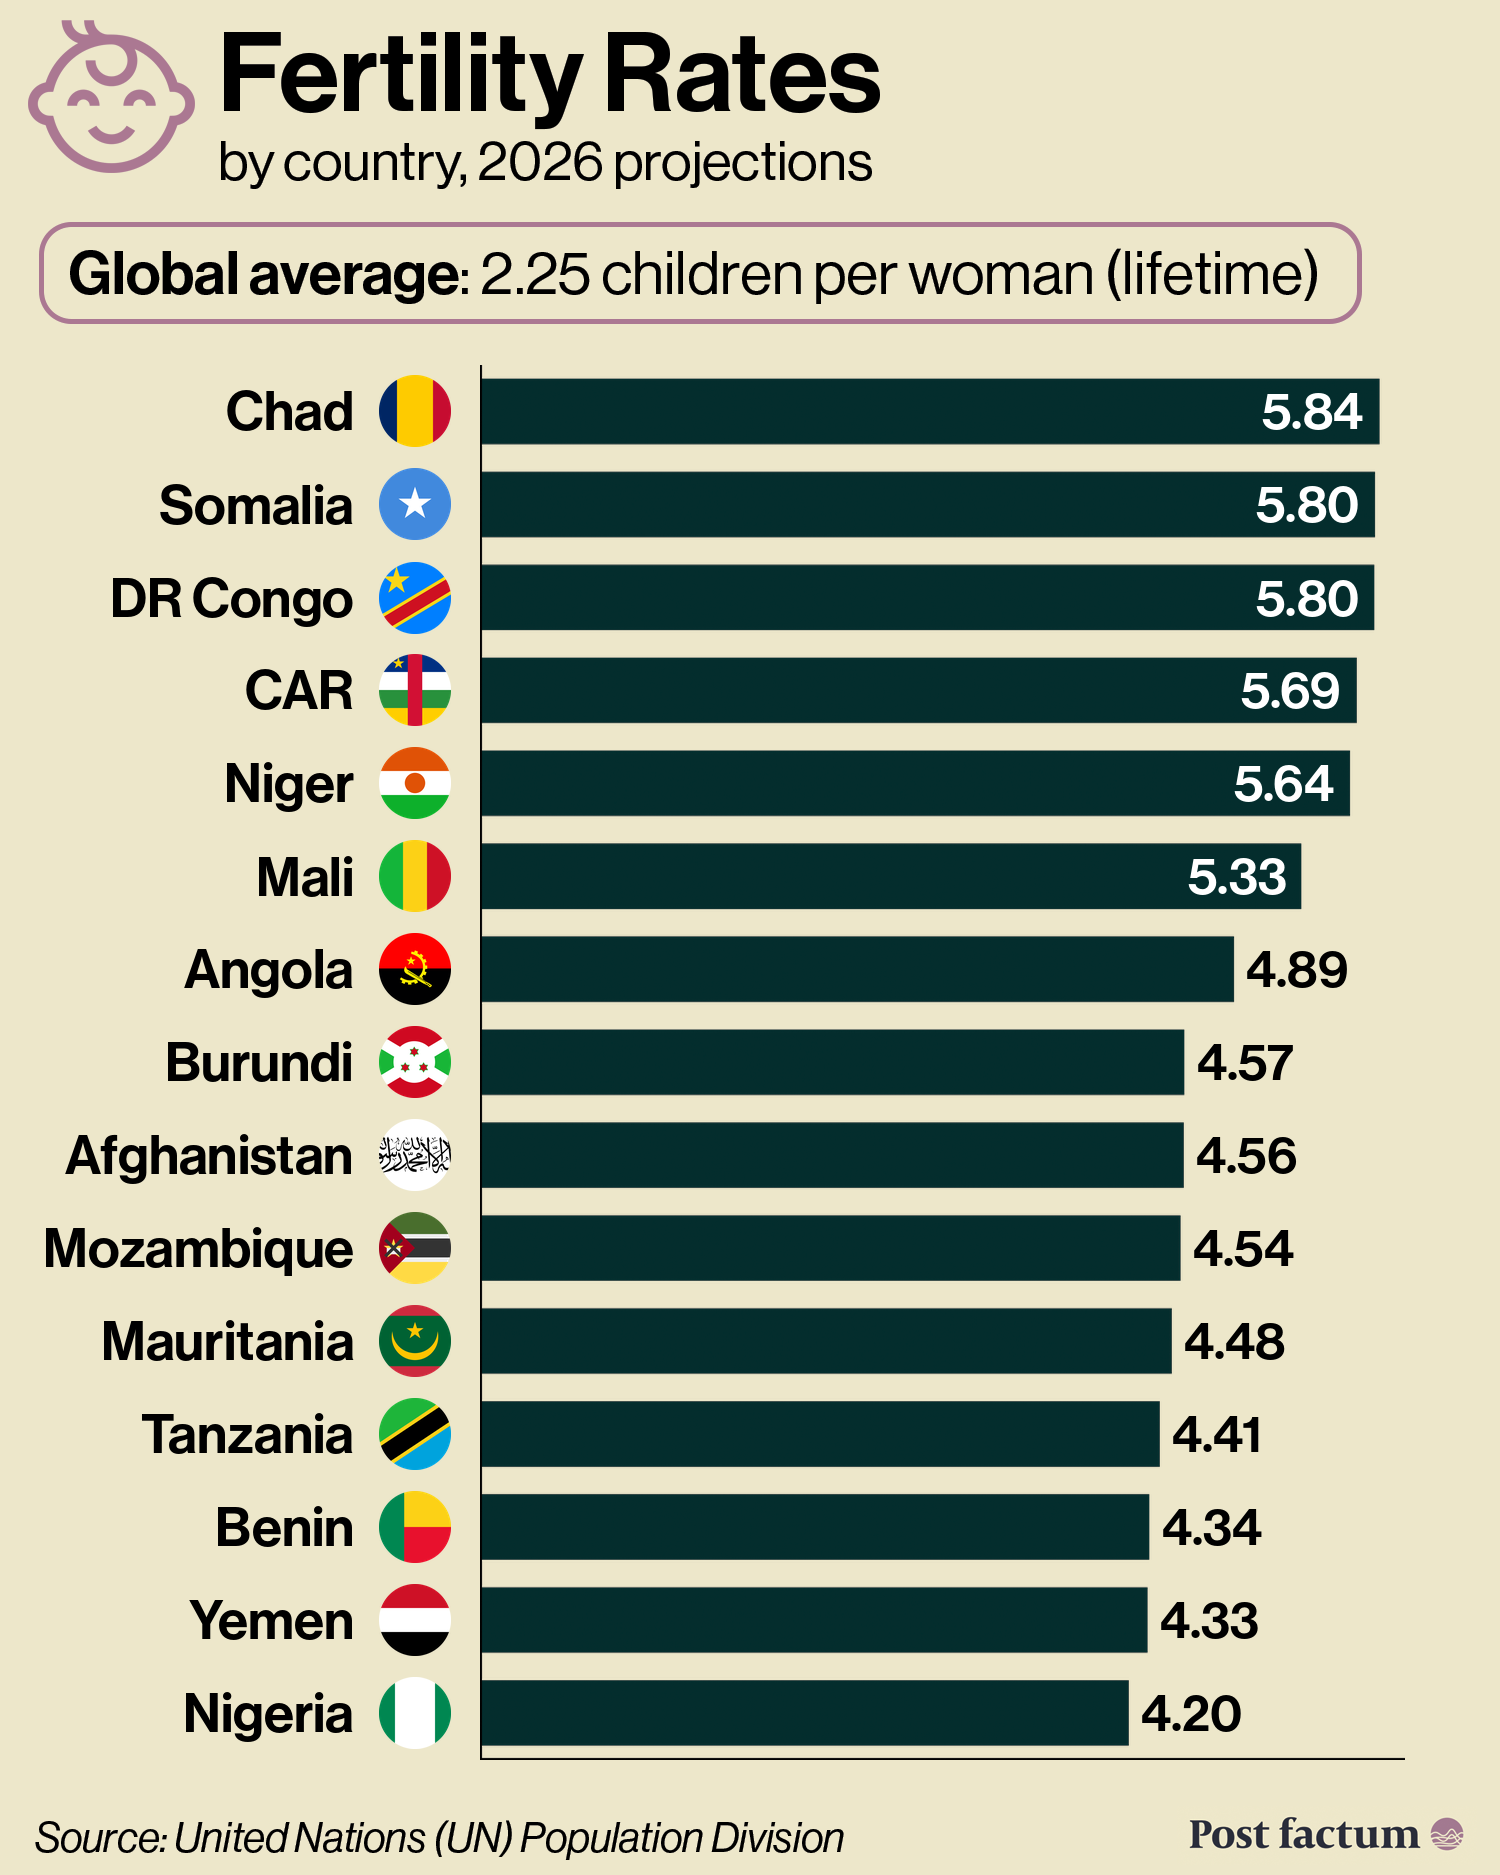
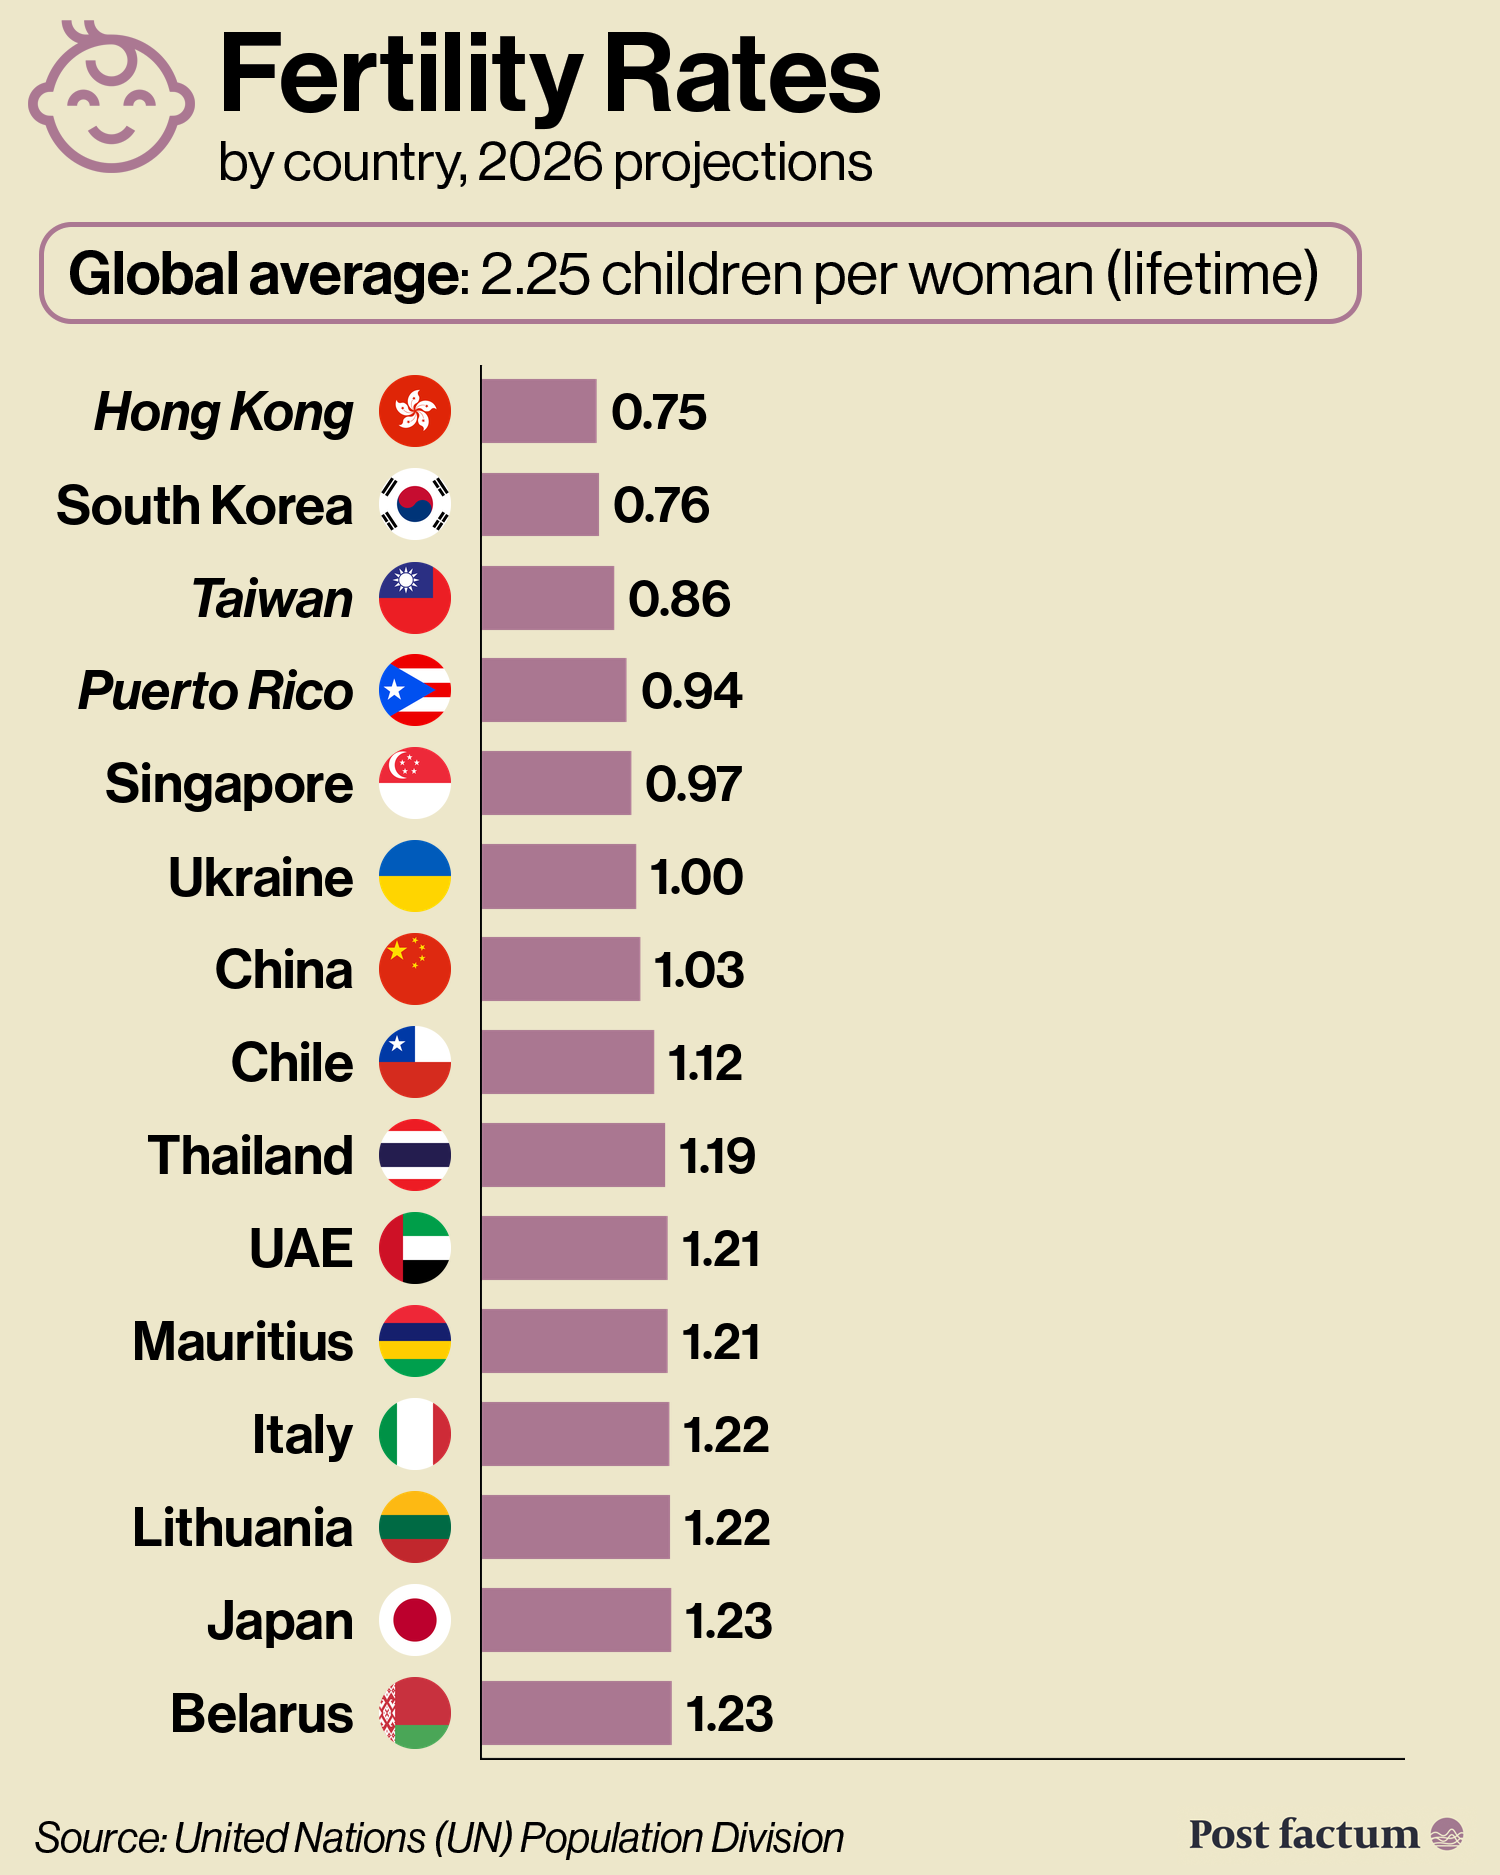
Fertility by Region
Fertility rates differ between world regions (births per woman, 2025):
- Africa: 4.0
- Oceania: 2.1
- Asia: 1.9
- South America and the Caribbean: 1.8
- North America: 1.6
- Europe: 1.4
In Asia, East Asia is at 1.0 and South Asia at 2.2, with India at 1.9.
Demographic transition: the shift from high birth and death rates to low ones as societies develop economically.
Death rates fall first, so populations grow quickly in between.
As birth rates fall, the working-age share of the population rises for a few decades.
- Demographic dividend: the extra economic growth possible while this share is at its highest, before ageing raises welfare costs.
Sub-Saharan Africa is the region with the highest fertility (4.2) and a population of 1.3 billion people, rising to over 3.3 billion by 2100.
Some countries in the region have adopted policies to reduce fertility, especially supplying free contraceptives.
Goal: to reduce pressure on land, resources (including food and water) and social services.
In 1979-80, China introduced the one-child policy, limiting many families to 1 child.
- Its fertility rate had already fallen from about 6.1 in 1970 to 2.75 in 1979, during an earlier campaign for fewer children.
In 1983, officials recorded 14.4 million abortions and 20.7 million sterilisations, many of them forced.
Many families chose sons through sex-selective abortion, so births peaked at 121 boys for every 100 girls in 2004 (the natural level is about 105).
- China had about 29 million more men than women in 2025.
China allowed 2 children per family in 2016 and 3 in 2021, then dropped the fines, ending birth limits in practice.
In 2025, China recorded 7.92 million births, the fewest since 1949, and its population fell for the 4th year in a row.
The long-term issue: China’s population is ageing before the country has become “wealthy” (average income per person).
- The one-child policy worsened this problem, as millions of ageing parents have fewer children than their own parents had.
The Ageing Population
The world’s median age is 31, rising to 42 by 2100.
Why? Life expectancy grows as healthcare improves, and falling fertility means the share of young people in the population is smaller.
Global life expectancy was 73.3 years in 2024, up from 60 years in 1980, mainly because:
- better survival in early childhood
- better treatment of diseases in older ages
People aged 65 and over make up 10% of the world’s population, rising to 16% by 2050 (31% of them in China).
Dependency ratio: the average number of children under 14 and adults over 65 (dependants), per 100 people of working age (15-64).
Why is it important? The working-age group generates most of the country’s resources, including those needed to support children and the elderly.
The world has 1.9 working-age people for every dependant, falling to 1.7 by 2050.
- In Africa, most dependants are children, while in Europe, Japan and China the growing group is older people.
China’s population of working age is projected to fall by 25% between 2025 and 2050 on current trends.
The EU’s working-age population would decline by 17% in the same period.
These countries would need to either (1) boost fertility rates significantly, or (2) increase the inflow of migrants into the workforce.
South Korea cut its armed forces from 563,000 troops in 2019 to about 450,000 in 2025, as the number of young men fell.
Russia recorded its fewest births since 1999 in 2024, and stopped publishing monthly birth data in 2025.
Some countries saw a rebound in fertility rates in the 2000s that has now ended, including Germany, France, Russia and Sweden.
- This was linked to economic growth and the average age of having children levelling off.
Programmes to raise birth rates have had “positive but limited” effects.
South Korea declared a “demographic national emergency” in 2024; its fertility rate rose from 0.72 in 2023 to 0.80 in 2025.
Globally, pro-fertility policies include cash payments, housing support, providing childcare, covering medical expenses, promoting marriage and propaganda.
- A review of 35 studies found that more childcare raises the number of children families have, while cash payments mostly change when they have them.
Governments are also raising retirement ages, especially as people live longer and healthier lives on average.
- This increases the size of the workforce by keeping some people in it for longer.
The automation of work contributes to covering the decrease in the size of the human workforce (with robots and AI).
Migration
About 3.7% of the world’s population are international migrants (304 million people in 2024).
Why? Most seek better economic opportunities, while destination countries look to increase their workforce.
- About 1 in 6 migrants (52 million) fled war or persecution, the highest share since the 1950s.
81% of migrants live in high- or upper-middle-income countries.
Europe hosts 94 million immigrants, about half of whom came from other European countries.
- In the EU, deaths have exceeded births every year since 2012, so migration is the only source of population growth.
The US hosts 52 million immigrants, about half from South America and the Caribbean.
Remittances (money sent back home by migrants) to low- and middle-income countries reached about $729 billion in 2025.
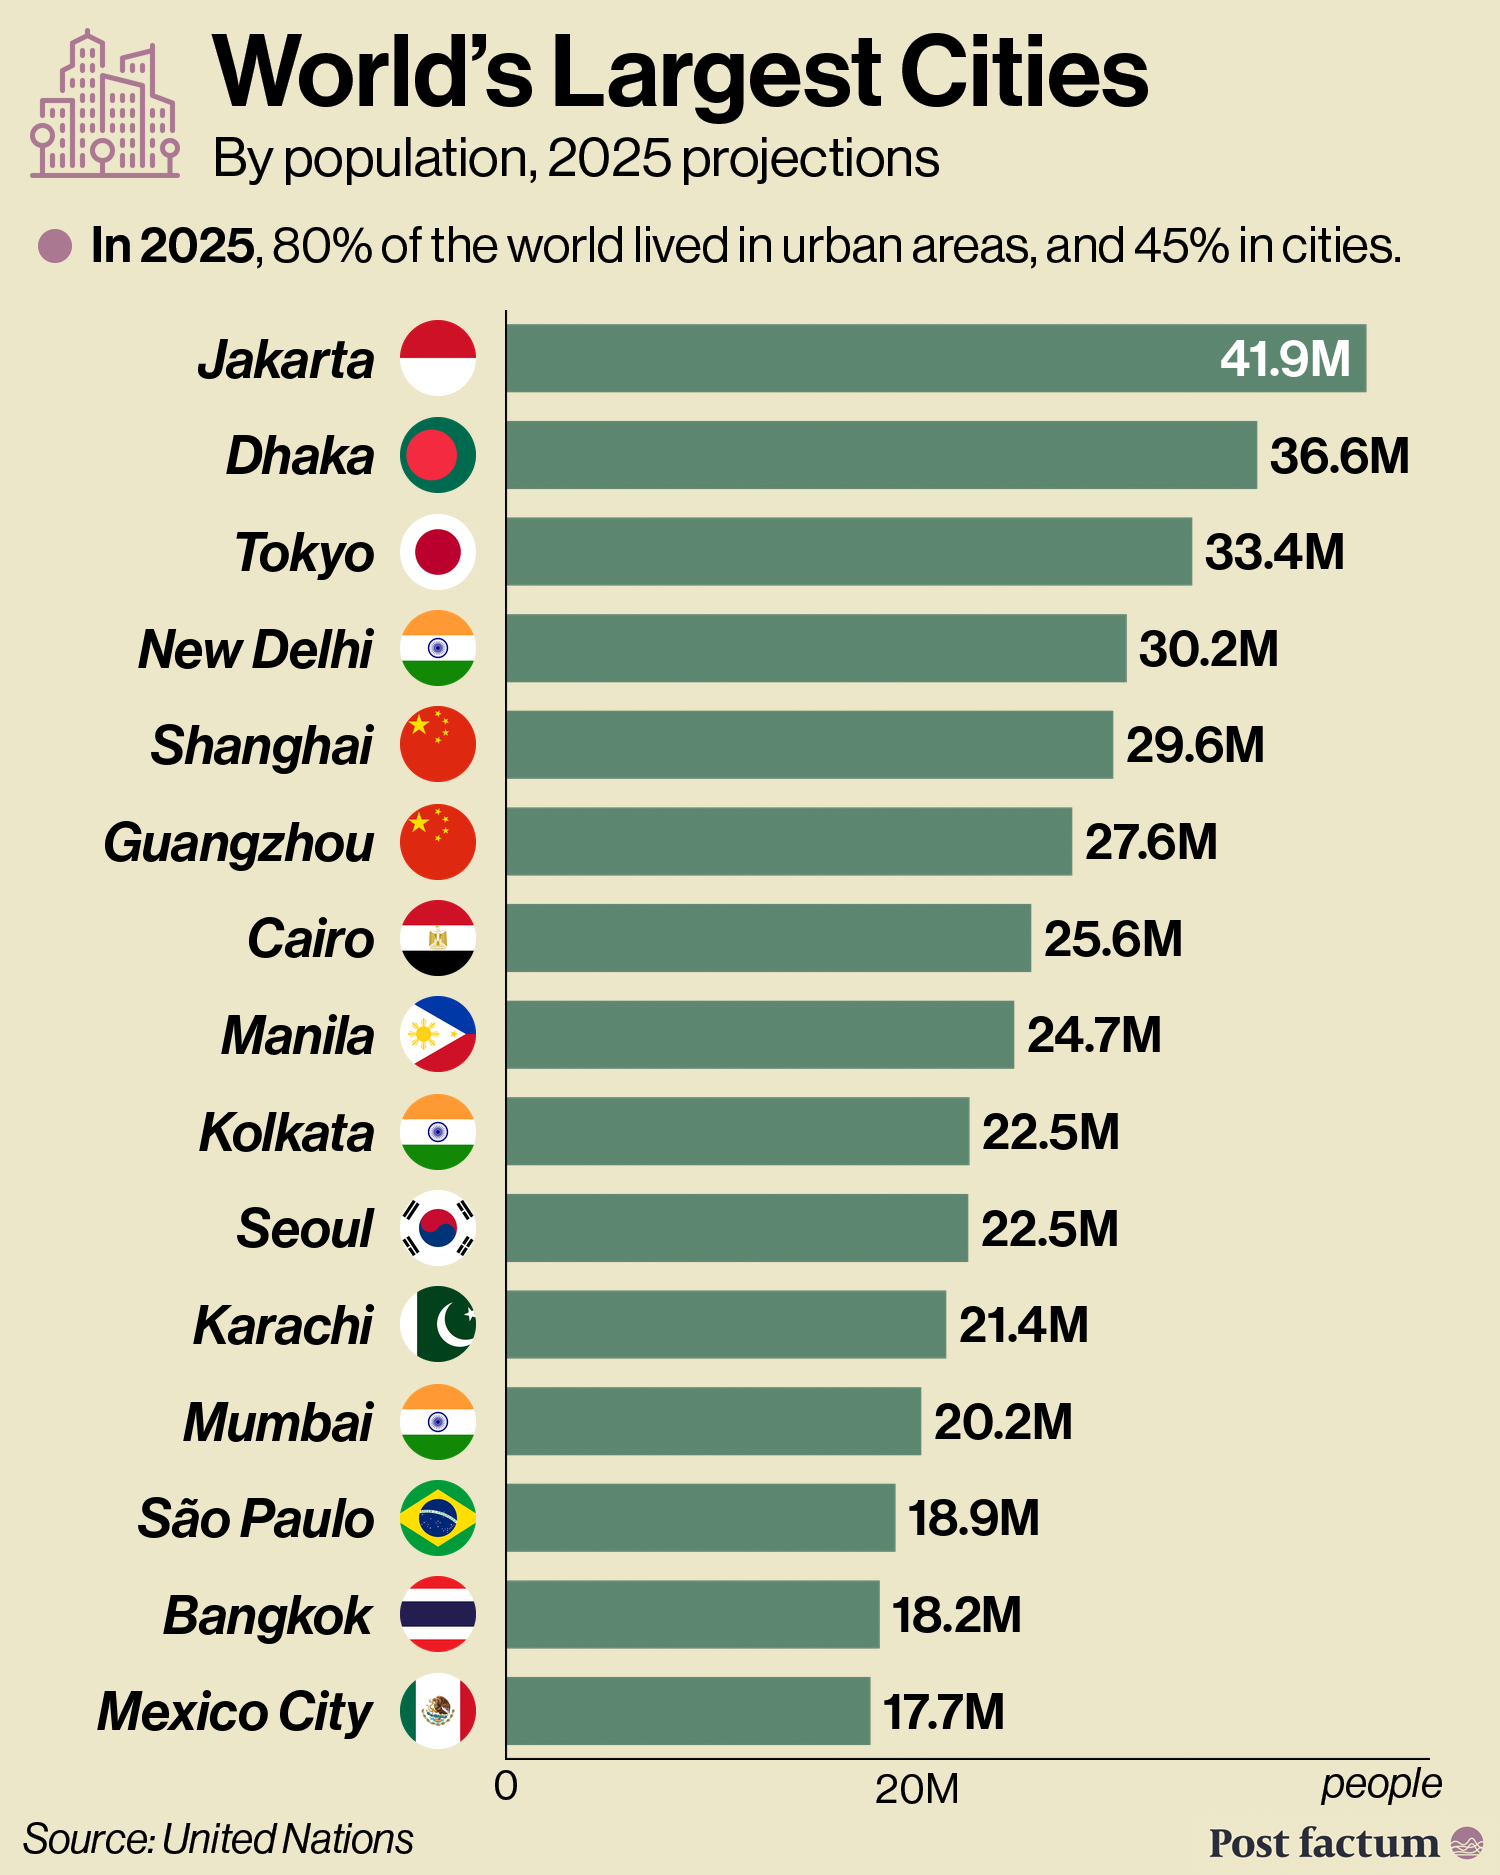
The Urban Population
Since around 2007, most people on the planet live in urban areas, as each country defines them.
On the UN’s common definition, 45% of people live in cities, 36% in towns and 19% in rural areas (2025).
- Cities have a population density of 1,500+ people per square kilometre and a population of over 50,000.
- Towns have a density of 300+ and a population of over 5,000, under this definition.
The number of megacities (over 10 million people) grew from 8 in 1975 to 33 in 2025.
Thank you for reading!
We need your help to survive
Post factum is independent and reader-powered.
We have to reach 5,000 Pro members to cover our costs and continue publishing, or the funding we have raised so far will run out.
Please help us hit this goal and keep bringing you data-driven, retrospective reporting.
Join as a Founding Member and get all our past and future content at the best rate.
Your fee will go towards paying our staff and running our digital systems.
Keep exploring:


This week on Post factum Pro:

Join Post factum Pro to access the comment section.